
Property Sales
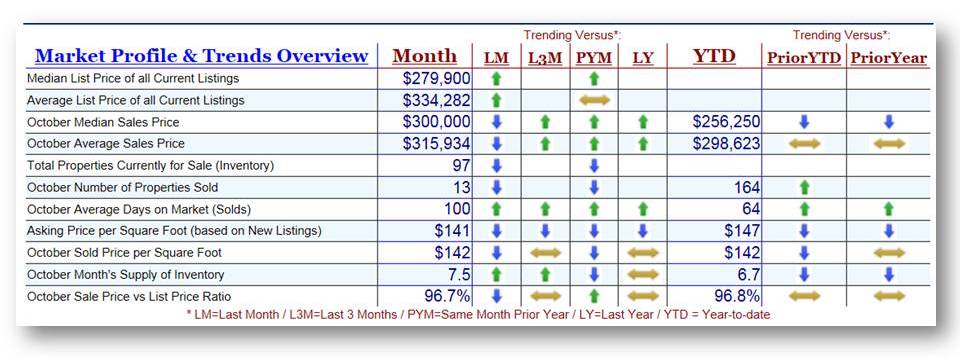
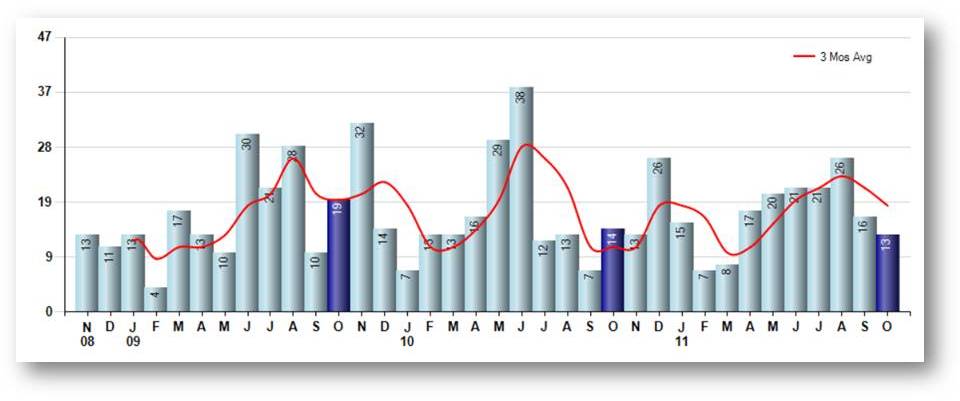
October Property sales were 13, down -7.1% from 14 in
October of 2010 and -18.8% lower than the 16 sales last month. October 2011
sales were at their lowest level compared to October of 2010 and 2009. October
YTD sales of 164 are running 1.2% ahead of last year’s year-to-date sales of
162.
Prices
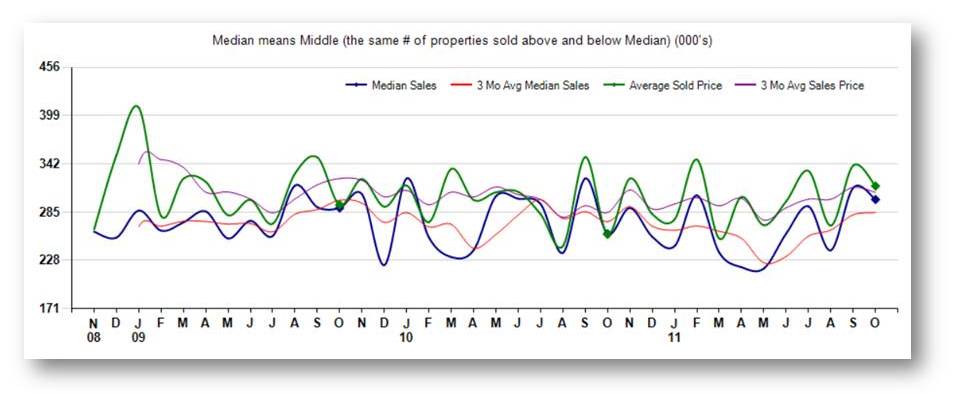
The Median Sales Price in October was $300,000, up 15.6%
from $259,500 in October of 2010 and down -4.4% from $313,875 last month. The
Average Sales Price in October was $315,934, up 22.1% from $258,821 in October
of 2010 and down -7.1% from $340,203 last month. October 2011 ASP was at
highest level compared to October of 2010 and 2009.
Inventory & MSI
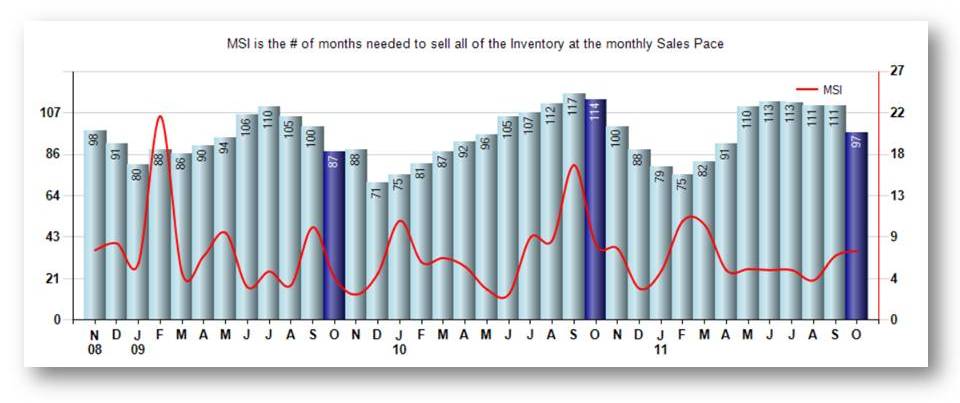
The Total Inventory of Properties available for sale as of
October was 97, down -12.6% from 111 last month and down -14.9% from 114 in
October of last year. October 2011 Inventory was at a mid range compared to
October of 2010 and 2009.
A comparatively lower MSI is more beneficial for sellers while a higher MSI is
better for buyers. The October 2011 MSI of 7.5 months was at a mid range
compared with October of 2010 and 2009.
Market Time
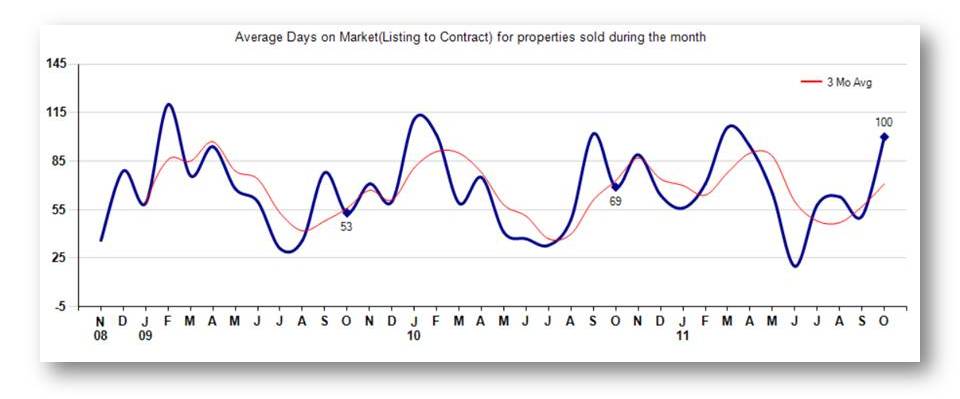
The average Days On Market(DOM) shows how many days the
average Property is on the Market before it sells. An upward trend in DOM tends
to indicate a move towards more of a Buyer’s market, a downward trend a move
towards more of a Seller’s market. The DOM for October was 100, up 96.1% from
51 days last month and up 44.9% from 69 days in October of last year. The
October 2011 DOM was at its highest level compared with October of 2010 and
2009.
Selling Price per Square Foot
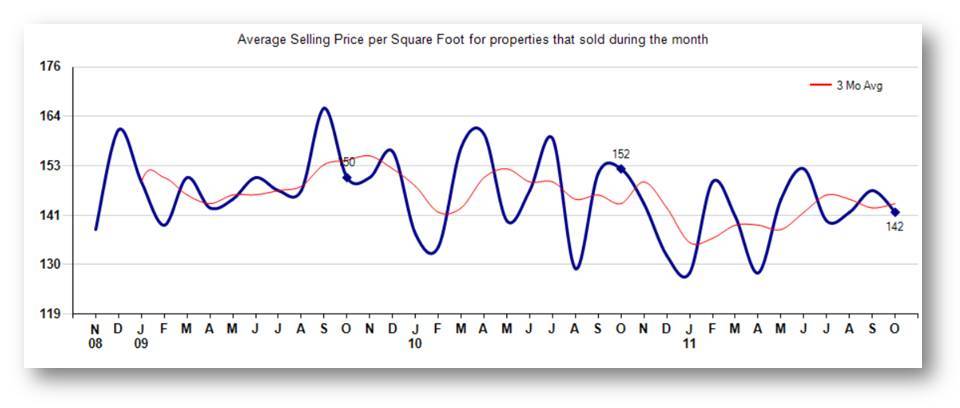
The Selling Price per Square Foot is a great indicator for
the direction of Property values. Since Median Sales Price and Average Sales
price can be impacted by the ‘mix’ of high or low end Properties in the market,
the selling price per square foot is a more
normalized indicator on the direction of Property values.
The October 2011 Selling Price per Square Foot of $142 was down -3.4% from $147
last month and down -6.6% from $152 in October of last year.
Selling Price vs Original Listing Price
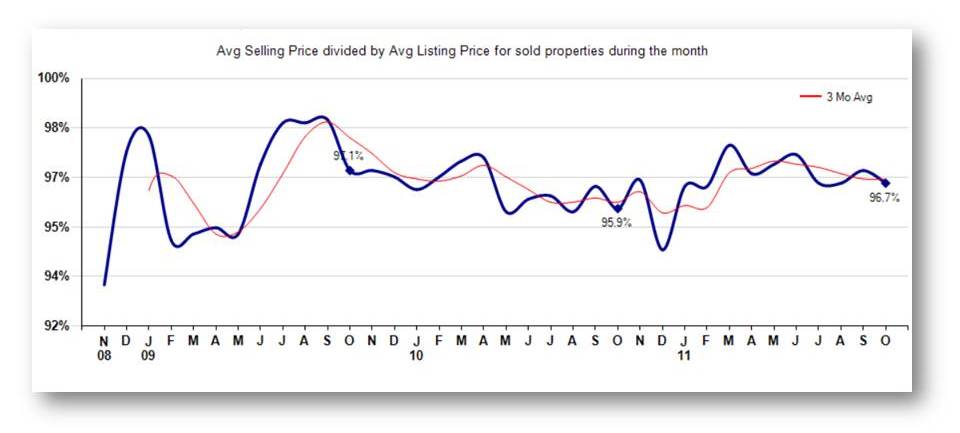
The Selling Price vs Original Listing Price reveals the
average amount that Sellers are agreeing to come down from their original list
price. The lower the ratio is below 100% the more of a Buyer’s market exists, a
ratio at or above 100% indicates more of a Seller’s market. The October 2011
Selling Price vs Original List Price of 96.7% was down from 97.1% last month
and up from 95.9% in October of last year.
Inventory/ New Listings / Sales
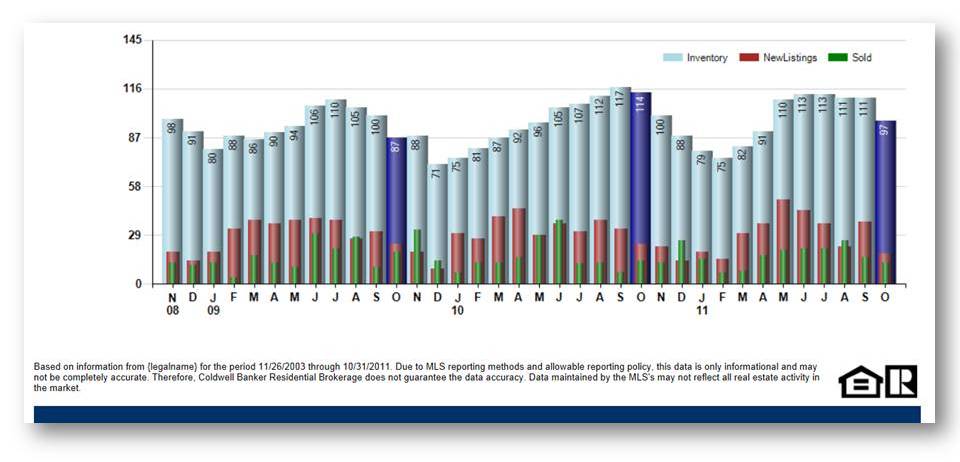
‘This last view of the market combines monthly inventory
of Properties for sale along with New Listings and Sales. The graph shows the
basic annual seasonality of the market as well as the relationship between
these items. The number of New Listings in October 2011 was 18, down -51.4%
from 37 last month and down -25.0% from 24 in October of last year.
If you are looking for a new home, or you would like to sell your home and move into a larger one, please contact me. I will be glad to assist you anywhere in the Greater Hartford area.

 CTrealtorTatyana